Stay Ahead of the Curve
Latest AI news, expert analysis, bold opinions, and key trends — delivered to your inbox.
Unlocking Data Magic: Create Stunning Charts with Vizzlo AI
41 min read A Step-by-Step Guide to AI-Powered Data Visualization. August 03, 2025 19:22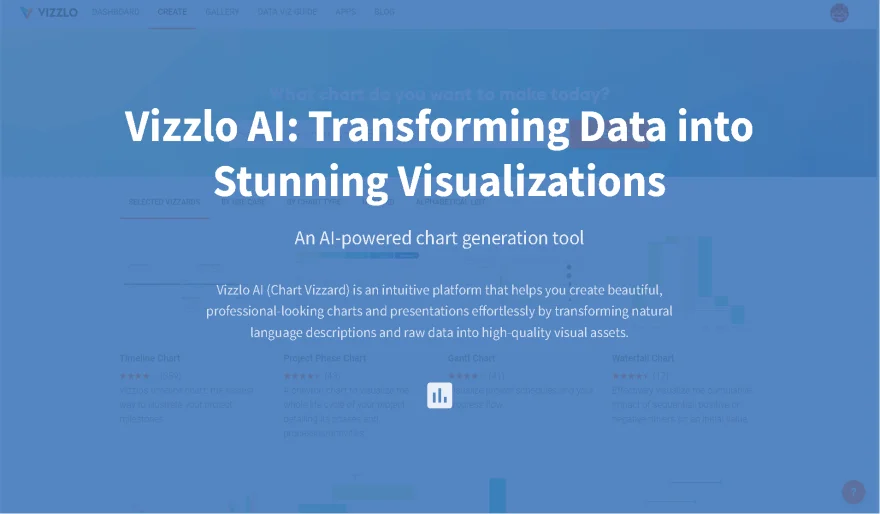
Ever felt like you're drowning in a sea of data, struggling to make sense of all those messy spreadsheets? What if there was a simple way to transform your raw data into stunning, insightful charts without any complex coding or design skills? Today, we’re diving into a tool that does exactly that.
Our AI tool of the day is Vizzlo AI. Vizzlo AI is an intuitive platform that helps you create beautiful, professional-looking charts and presentations effortlessly. It’s designed for anyone who needs to visualize data quickly, from business professionals and marketers to students and researchers. By simply describing the chart you want and pasting your data, Vizzlo AI handles all the heavy lifting, generating a perfect visualization in seconds.
Vizzlo AI’s core function is to transform natural language descriptions and raw data into high-quality visual assets. Instead of manually building charts, you tell the AI what you need—like "a bar chart showing sales by region" or "a timeline of our project milestones"—and it automatically creates it. This removes the need to navigate complex menus or understand intricate design principles, making data visualization accessible to everyone.
How to Use:
Go to the Vizzlo AI website and sign up for an account.
On the dashboard, locate the AI chart generator.
In the prompt box, describe the type of chart you want to create (e.g., "a line chart").
Paste your raw data directly into the data input field.
Click 'Generate' and watch as Vizzlo AI instantly creates your custom chart. You can then download and customize it further.
Key Use Cases:
Creating professional business presentations and reports.
Visualizing marketing campaign results and performance metrics.
Generating insightful charts for academic papers and research projects.
Illustrating project timelines and team progress for internal communication.
Quickly analyzing financial data and sales trends.
The value of Vizzlo AI lies in its ability to democratize data visualization. It saves you countless hours of manual work and eliminates the frustration of using complicated software, allowing you to focus on telling a compelling story with your data rather than wrestling with the tools to create the visuals.
User Comments (0)
Popular Apps


 AI Agents